Teaching Introductory Data Science: Trial, Error, and Triumph for All

eCOTS 2026 Breakout Session 5B

Introductions (our team)

Headshot of a smiling woman with long brown hair.

  • California State University Channel Islands
  • 1 year of experience teaching IDS, plus TA experience!
  • Maximum of 25 students in each IDS class
  • Most students take IDS for to satisfy GE, some are DS majors

Headshot of a smiling woman with long brown hair.

  • Cypress (Community) College
  • 4 years of experience teaching IDS

Headshot of a smiling woman with short brown hair.

  • University of California, Irvine
  • 5+ years of experience teaching IDS

Introductions (you!)

Let’s do a Zoom waterfall chat! Type in the chat:

  • Institution type, and
  • years of experience teaching IDS (Introductory Data Science)

Don’t hit send yet! We’ll let everyone know when to send together.

Breakout Session

In this session we will cover content, tools, and examples from our IDS courses

All of our materials are open access (e.g., online textbook, real data sets, and teaching activity!)

Curriculum

What do we mean by introductory data science?

We will start by sharing the topics we cover in our IDS, highlighting similarities and differences

Doğucu’s topics

  • W1: Intro to R, Quarto, and GitHub & describing data with numbers
  • W2: Data visualization
  • W3 & W4: Data wrangling & good workflow practices
  • W5: Webscraping & midterm
  • W6: Intro to statistical inference & Beta-Binomial model
  • W7: Bayesian inference
  • W8: Frequentist inference
  • W9: Simple linear regression
  • W10: Multiple linear regression and logistic regression

Medina’s topics

  • W1: Intro to R, Quarto, and GitHub
  • W2: Data frames, variables, and summary stats
  • W3: Data visualization
  • W4 & W5: Data wrangling
  • W6: Exploratory data analysis project

Project provides a nice pause!

  • W7: Simple linear regression for prediction
  • W8: Multiple linear regression and model selection
  • W9: Logistic regression
  • W10: Clustering

I’ve found this to be the unit students do best in!

  • W11: Midterm & into to statistical inference
  • W12: Sampling distribution
  • W13: Bootstrap confidence intervals
  • W14: Work on final team project
  • W15: Intro to probability distributions for modeling

Castros’s topics

  • W1: Intro to R, Quarto, R packages, importing datasets
  • W2: Data frames & variables
  • W3: Sampling techniques, study design and ethics
  • W4: Summarizing data numerically
  • W5 & W6: Data visualization
  • W7 & W8: Data wrangling
  • W9: Midterm & sampling distribution
  • W10: Bootstrap confidence intervals and intro to hypothesis testing
  • W11: Inference for numerical data (t-test) and for categorical data (chi-square test)
  • W12: Simple linear regression
  • W13: Multiple linear regression and model evaluation
  • W14: Project
  • W15: Logistic regression

What about you?

What is your favorite topic to teach in data science? (If not taught yet, what has been your favorite topic to learn?)

Type your response in chat, but don’t hit send yet. We will all hit send together!

Tools

All three of us teach IDS using

  • R with tidyverse
  • Quarto
  • data-centered explorations
  • open-access materials
  • reproducible science

We are developing an open-access textbook for IDS!

Hello Data Science: A Friendly Introduction With Applications
https://hellodata.science/

Hello Data Science logo of dots colored into three clusters.

Released chapters

  1. hello woRLD
  2. Introduction to Data
  3. Data visualization
  4. Accessible Data Representations
  5. Dealing with Variables: Transformation & Aggregation
  6. Dealing with Specific Types of Variables: Strings, Dates, and Factors
  1. Dealing with Datasets: Joining, Pivoting, and Importing Datasets
  2. Tables, Functions, and Iterations
  3. Exploratory Data Analysis Project
  4. Reproducible Workflows for Data Science Projects

Highlights

Datasets

hellodatascience R package - CRAN hosted

  • American Time Use Survey for college students
  • Economic measures for countries
  • Micro FIFA confederations and 2026 World Cup datasets
  • Planets
  • Produce prices

sfemergency25 R package - GitHub hosted

Accessibility

Ch4: Accessible Data Representations

  • Color-blind friendly colors with Okabe-Ito palette and viridis (Ch 9) R package
  • Data verbalization
  • Data sonification
  • Data tactualization

Culturally aware data science

Example: when learning how to handle dates

Mathematical aspects Cultural aspects
years, months, days start of week
time zones beyond the Gregorian calendar (lunar-based calendars etc)

Diagrams

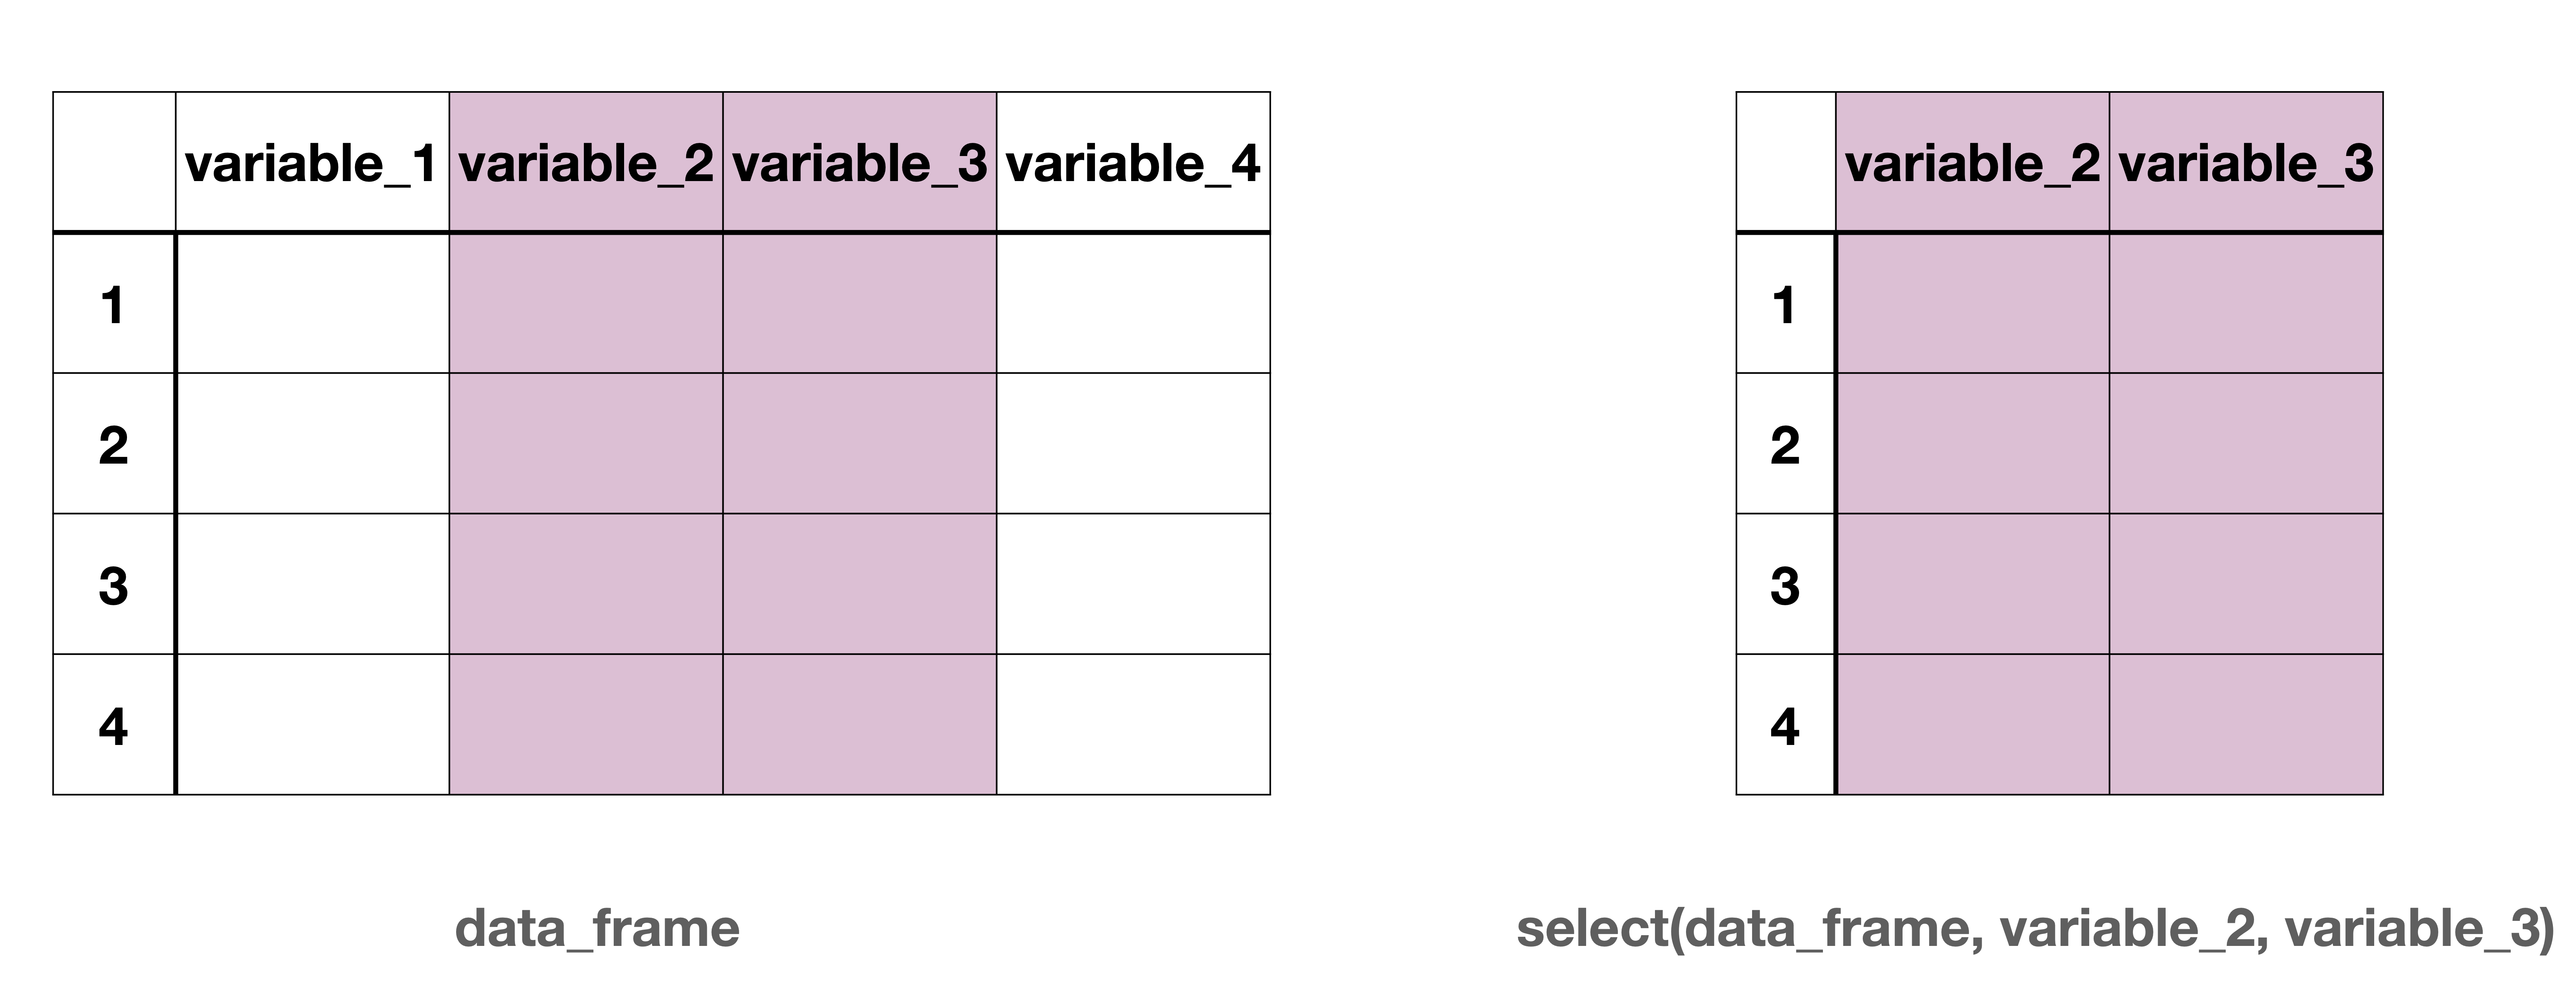
Side-by-side schematic of a data frame and a subset of it. On the left, a table labeled data_frame shows four rows (1–4) and four columns named variable_1, variable_2, variable_3, and variable_4. The columns variable_2 and variable_3 are shaded in pink to indicate selection. On the right, a smaller table labeled select(data_frame, variable_2, variable_3) displays only the two shaded columns, variable_2 and variable_3, for the same four rows, illustrating how selecting columns reduces the data frame to those variables.

Figure 1: Column wise subsetting of a data frame

Diagrams
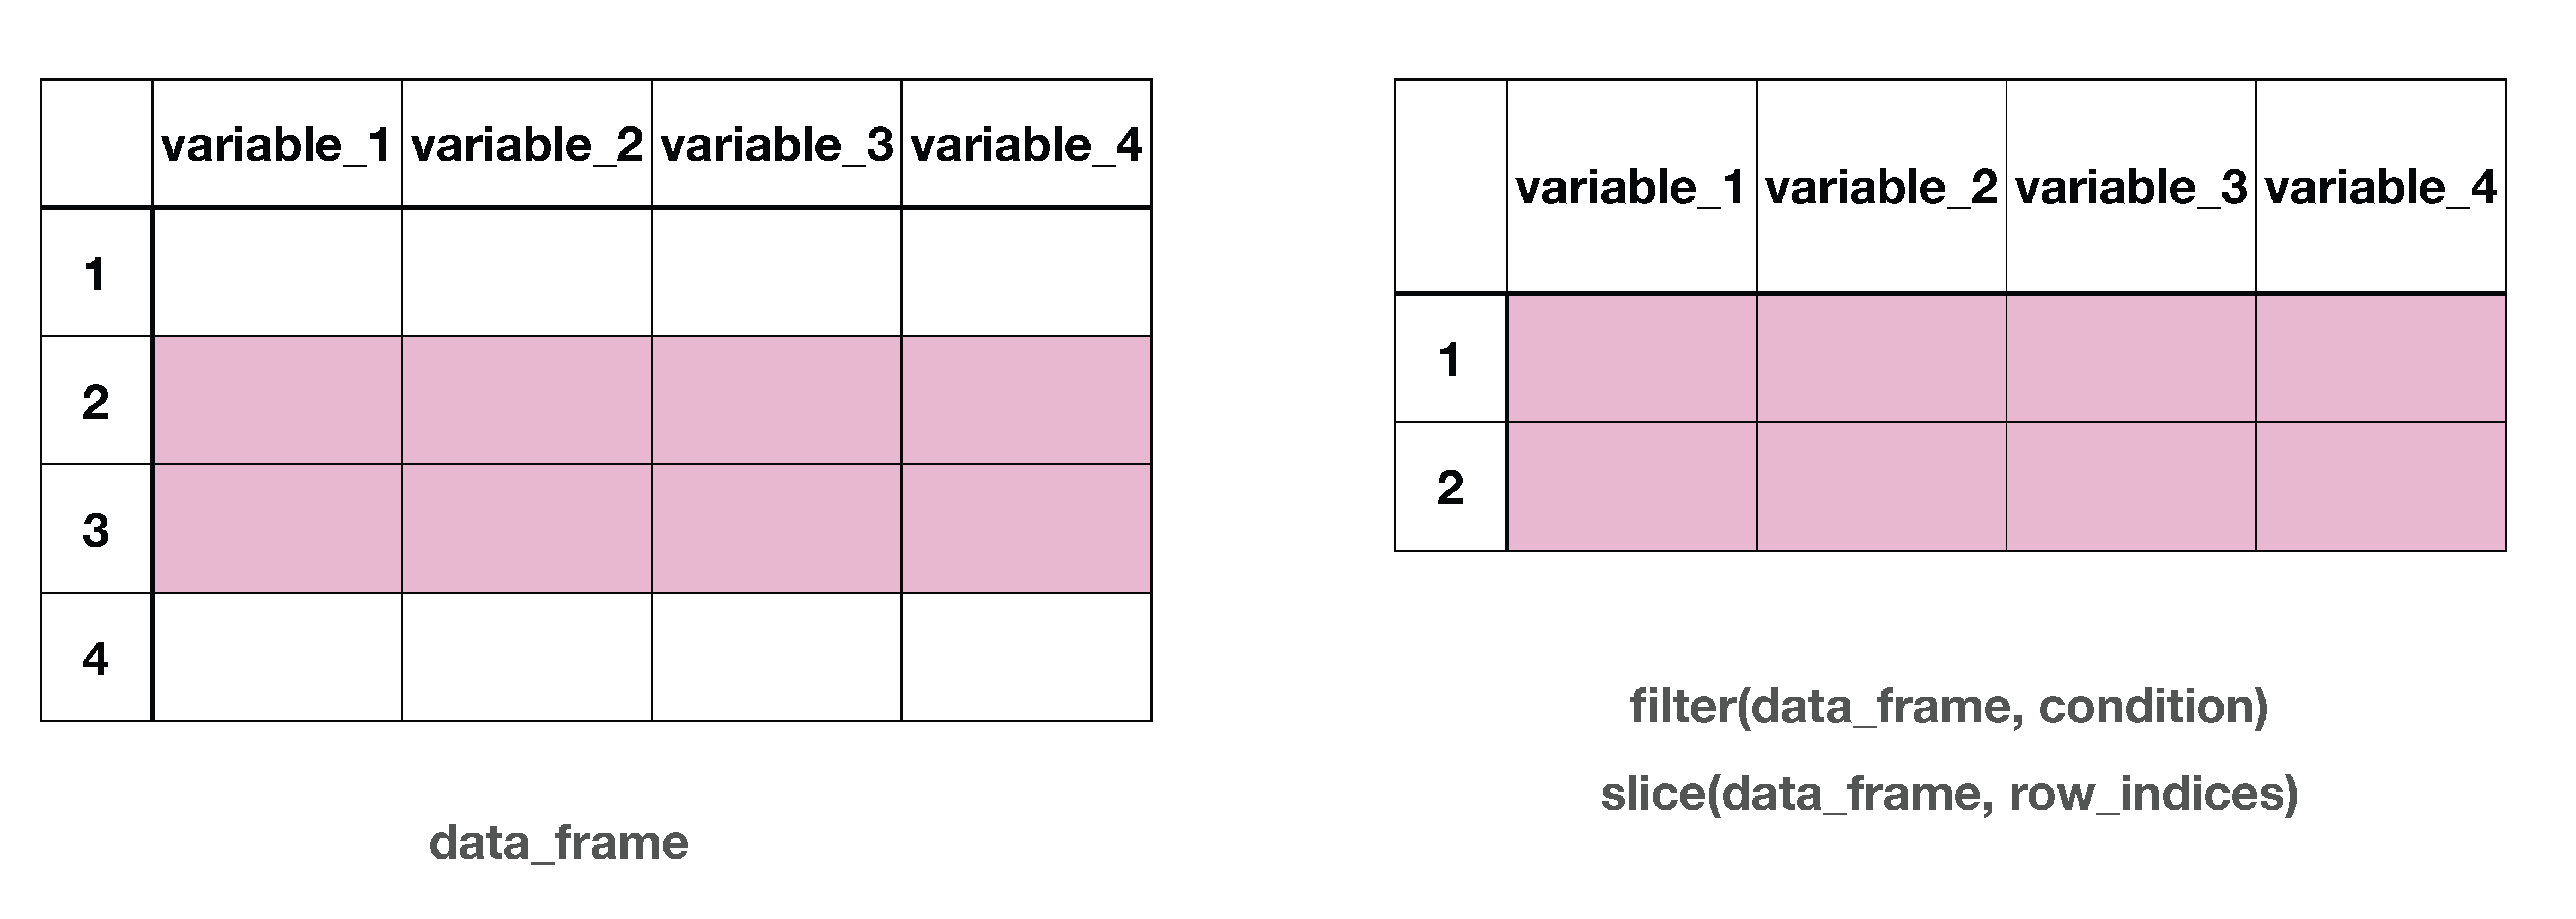
Side-by-side schematic illustrating row selection in a data frame. On the left, a table labeled data_frame shows four rows (1–4) and four columns (variable_1 to variable_4). Rows 2 and 3 are shaded in pink to indicate they are selected, while rows 1 and 4 are unshaded. On the right, a smaller table labeled filter(data_frame, condition) and slice(data_frame, row_indices) displays only the selected rows (rows 2 and 3) with all four columns preserved, demonstrating how filtering or slicing keeps rows that meet a condition.

Figure 2: Row wise subsetting of a data frame

Diagrams
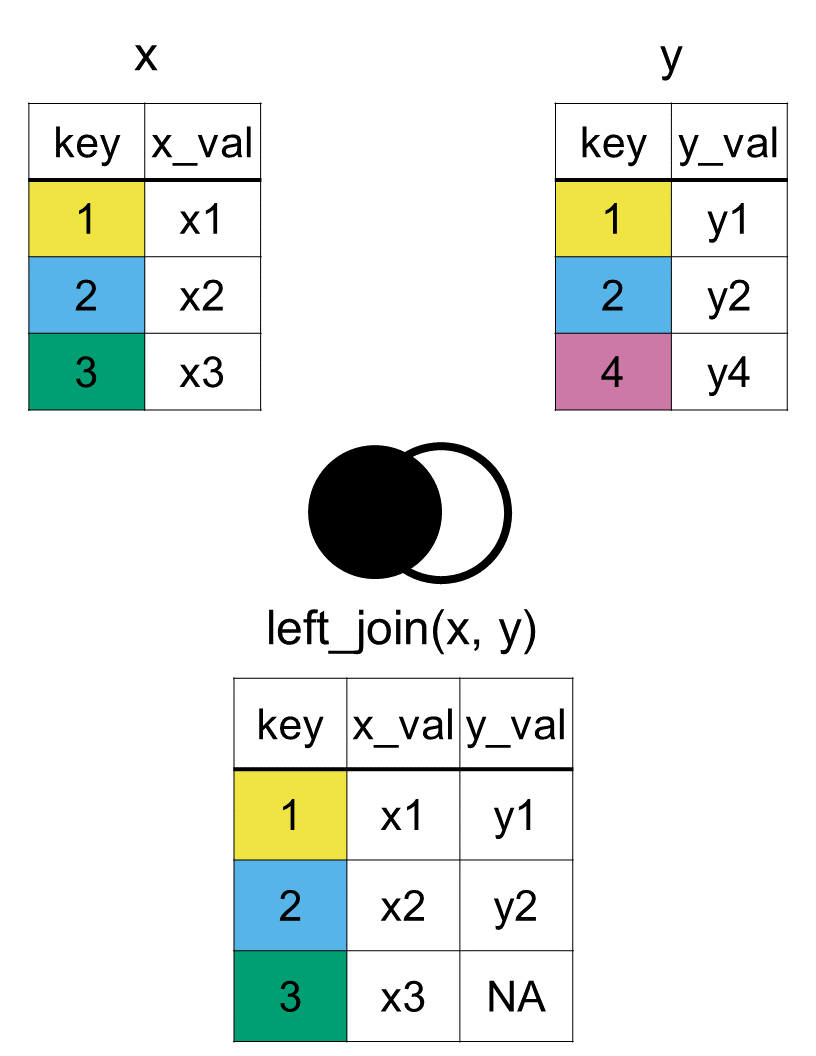
Two tables labeled x and y are shown. Table x has columns key and x_val with rows (1, x1), (2, x2), and (3, x3). Table y has columns key and y_val with rows (1, y1), (2, y2), and (4, y4). A Venn diagram highlights the entire left circle representing x. The result table of a left_join(x, y) includes columns key, x_val, and y_val with three rows: (1, x1, y1), (2, x2, y2), and (3, x3, NA), showing all rows from x and matching rows from y when available.

Figure 3: Diagram of the resulting dataset from a left join of datasets x and y

Example EDA

Ch 9 Exploratory Data Analysis Project
Ch 10 Reproducible Workflows for Data Science Projects

  • Utilizes CDC PLACES dataset with 40 measures across the US at 4 geographic levels
  • Accompanying GitHub repo shared
  • Educators can assign other locations and/or public health measures for individualized projects

Check-in

Is there anything you would like to adopt for your class? Or is there anything (materials, topics, etc) you would like to see?

Type your response in chat, but don’t hit send yet. We will all hit send together!

Classroom Activity

Inspired by USCOTS 2025 workshop by Anna Fergusson

From sketchy intuitions to imperfect rules: Using digital image data from drawings to introduce informal classification models

Step 0: Get into teams of 4 - 5

Step 1: Familiarize yourself with your landscape drawing area, 16 squares by 9 squares

A blank rectangular grid with a blue border and a white background overlaid with a uniform light blue grid of evenly spaced rows and columns, containing no data, labels, or axes, suggesting an empty chart or graph template awaiting content.

Step 2: Draw _______ within your drawing area in less than 15 seconds without showing it to your teammates.

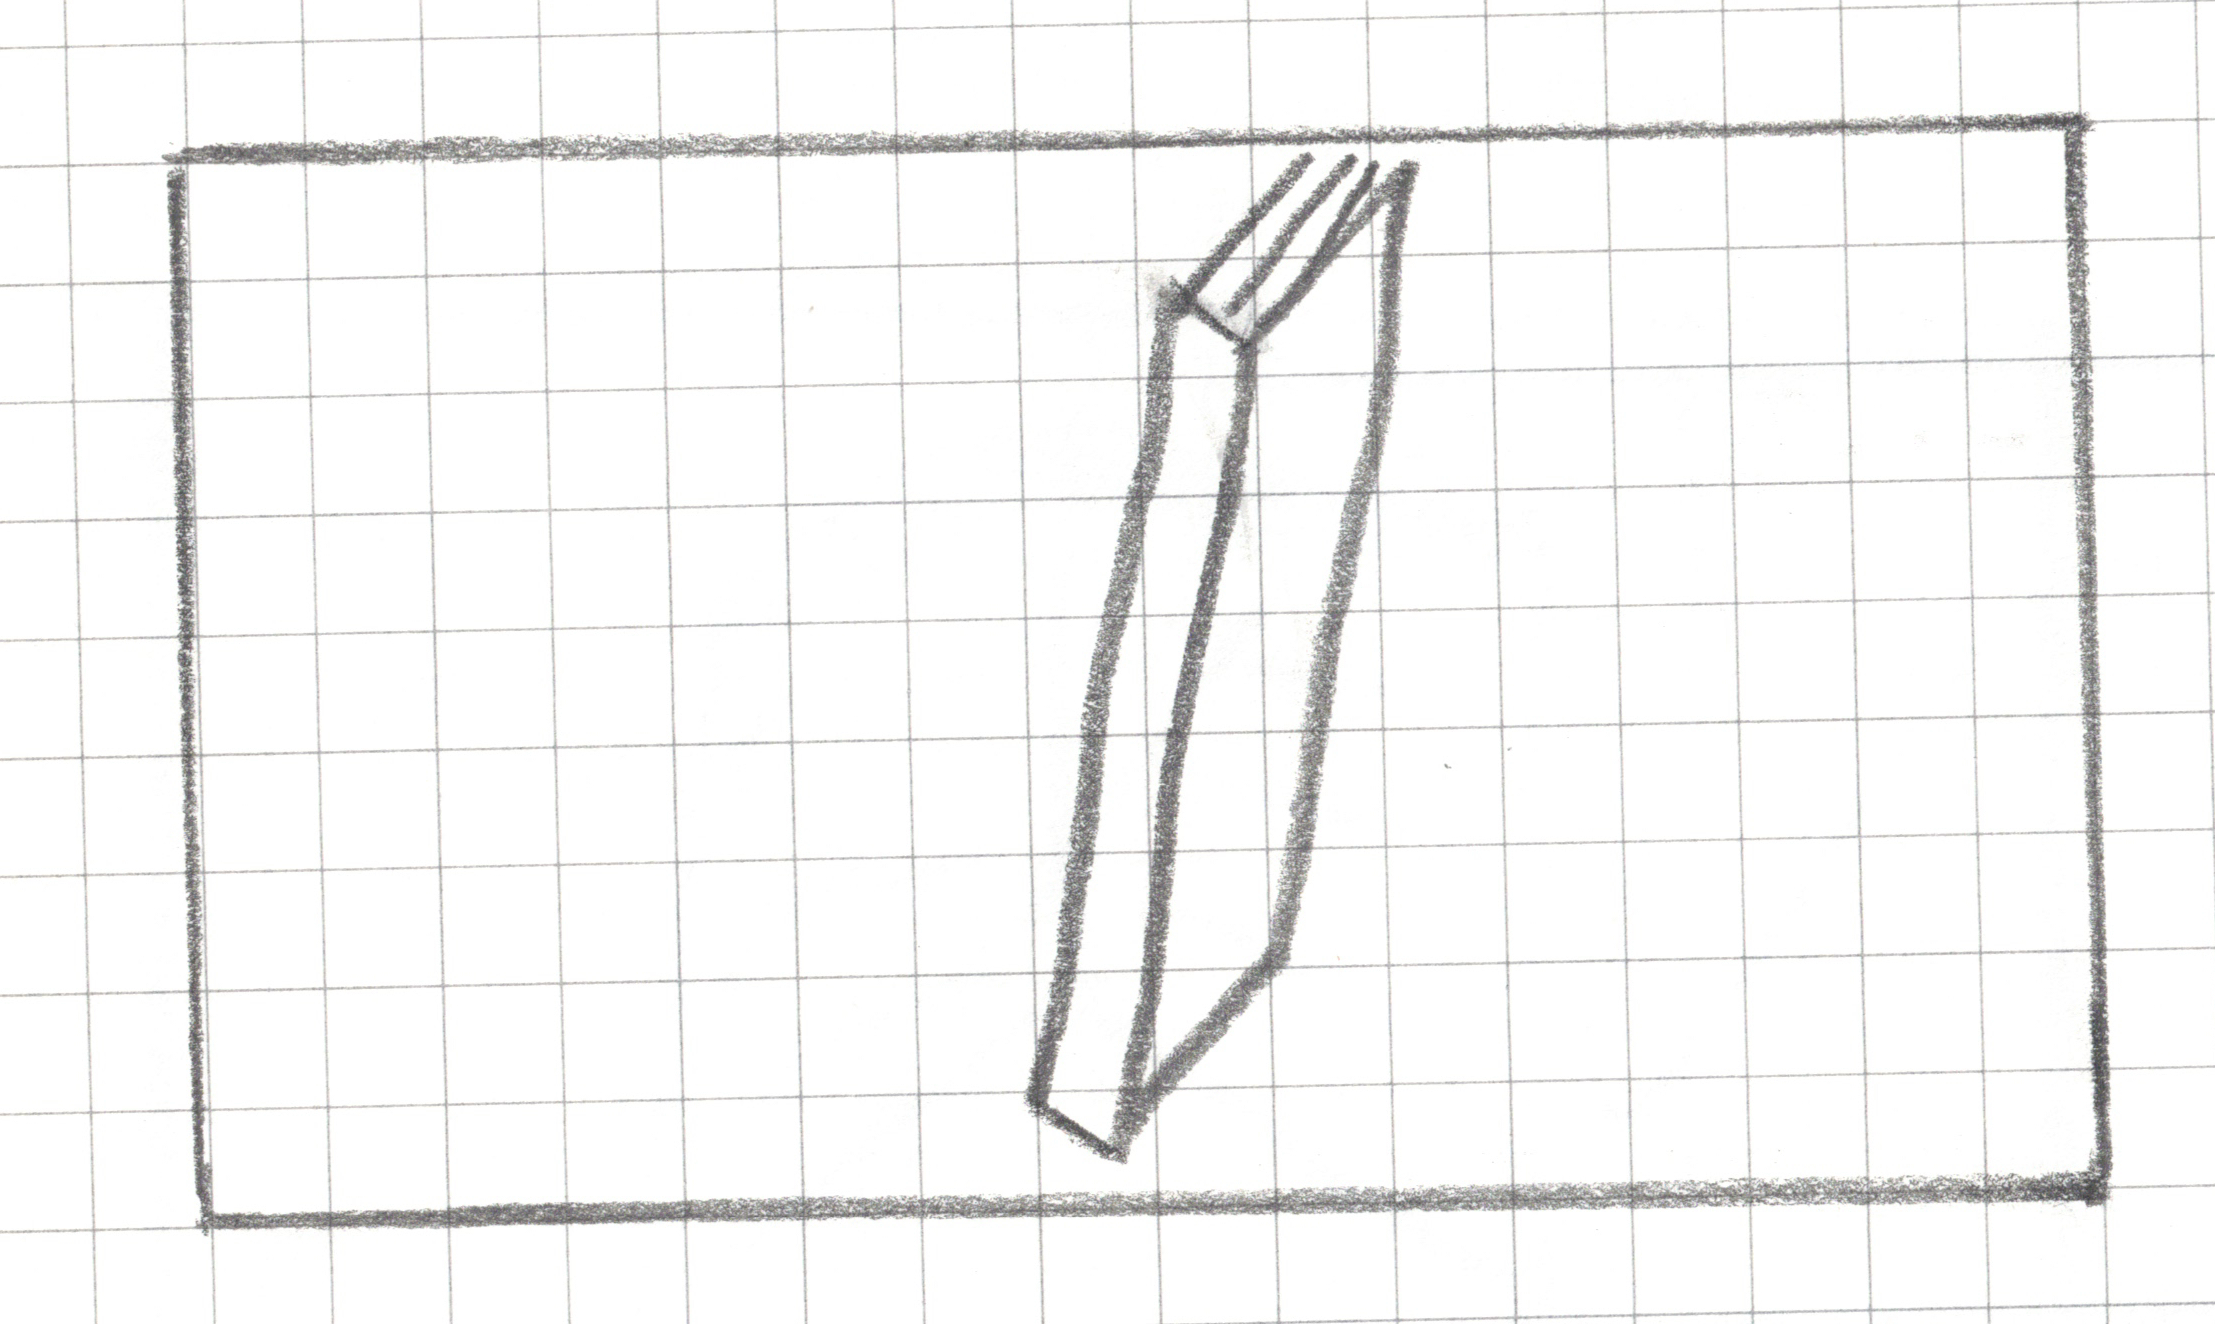
Step 2: Draw a book within your drawing area in less than 15 seconds without showing it to your neighbors.

Step 2.5: Now you can take a look at each others’ drawings.

An example:
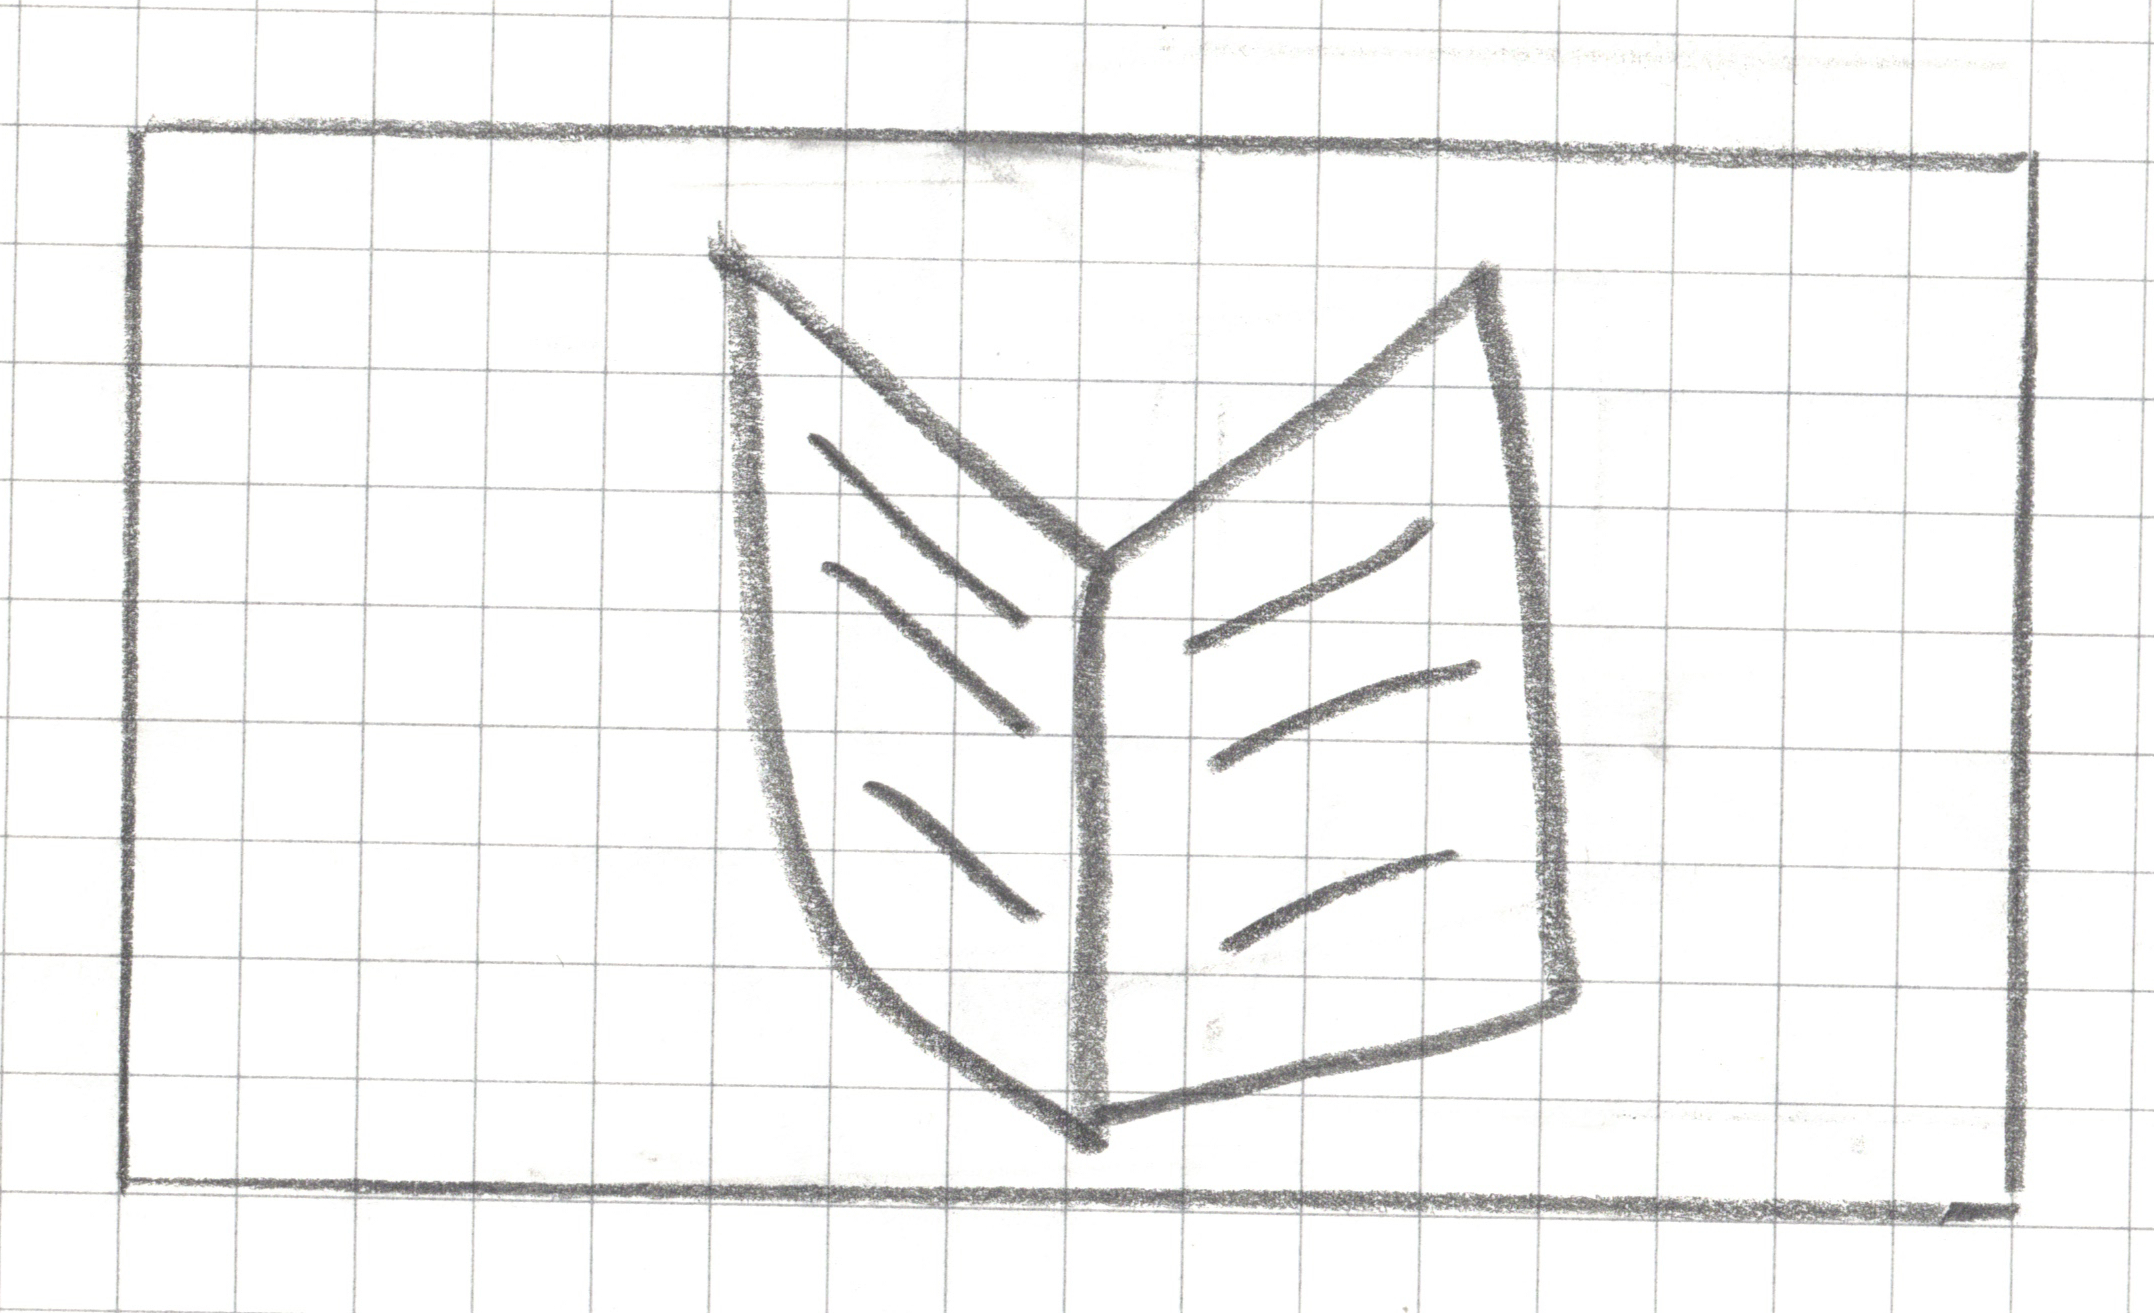
A hand-drawn pencil sketch on graph paper, enclosed in a rectangular border, showing a simple open book icon drawn in pencil — two symmetrical curved pages spread open at a central spine, with diagonal lines on each page representing text

Step 3: Pixelate your drawing

For any square that has a line, a dot or any pen/pencil mark, shade the whole square.
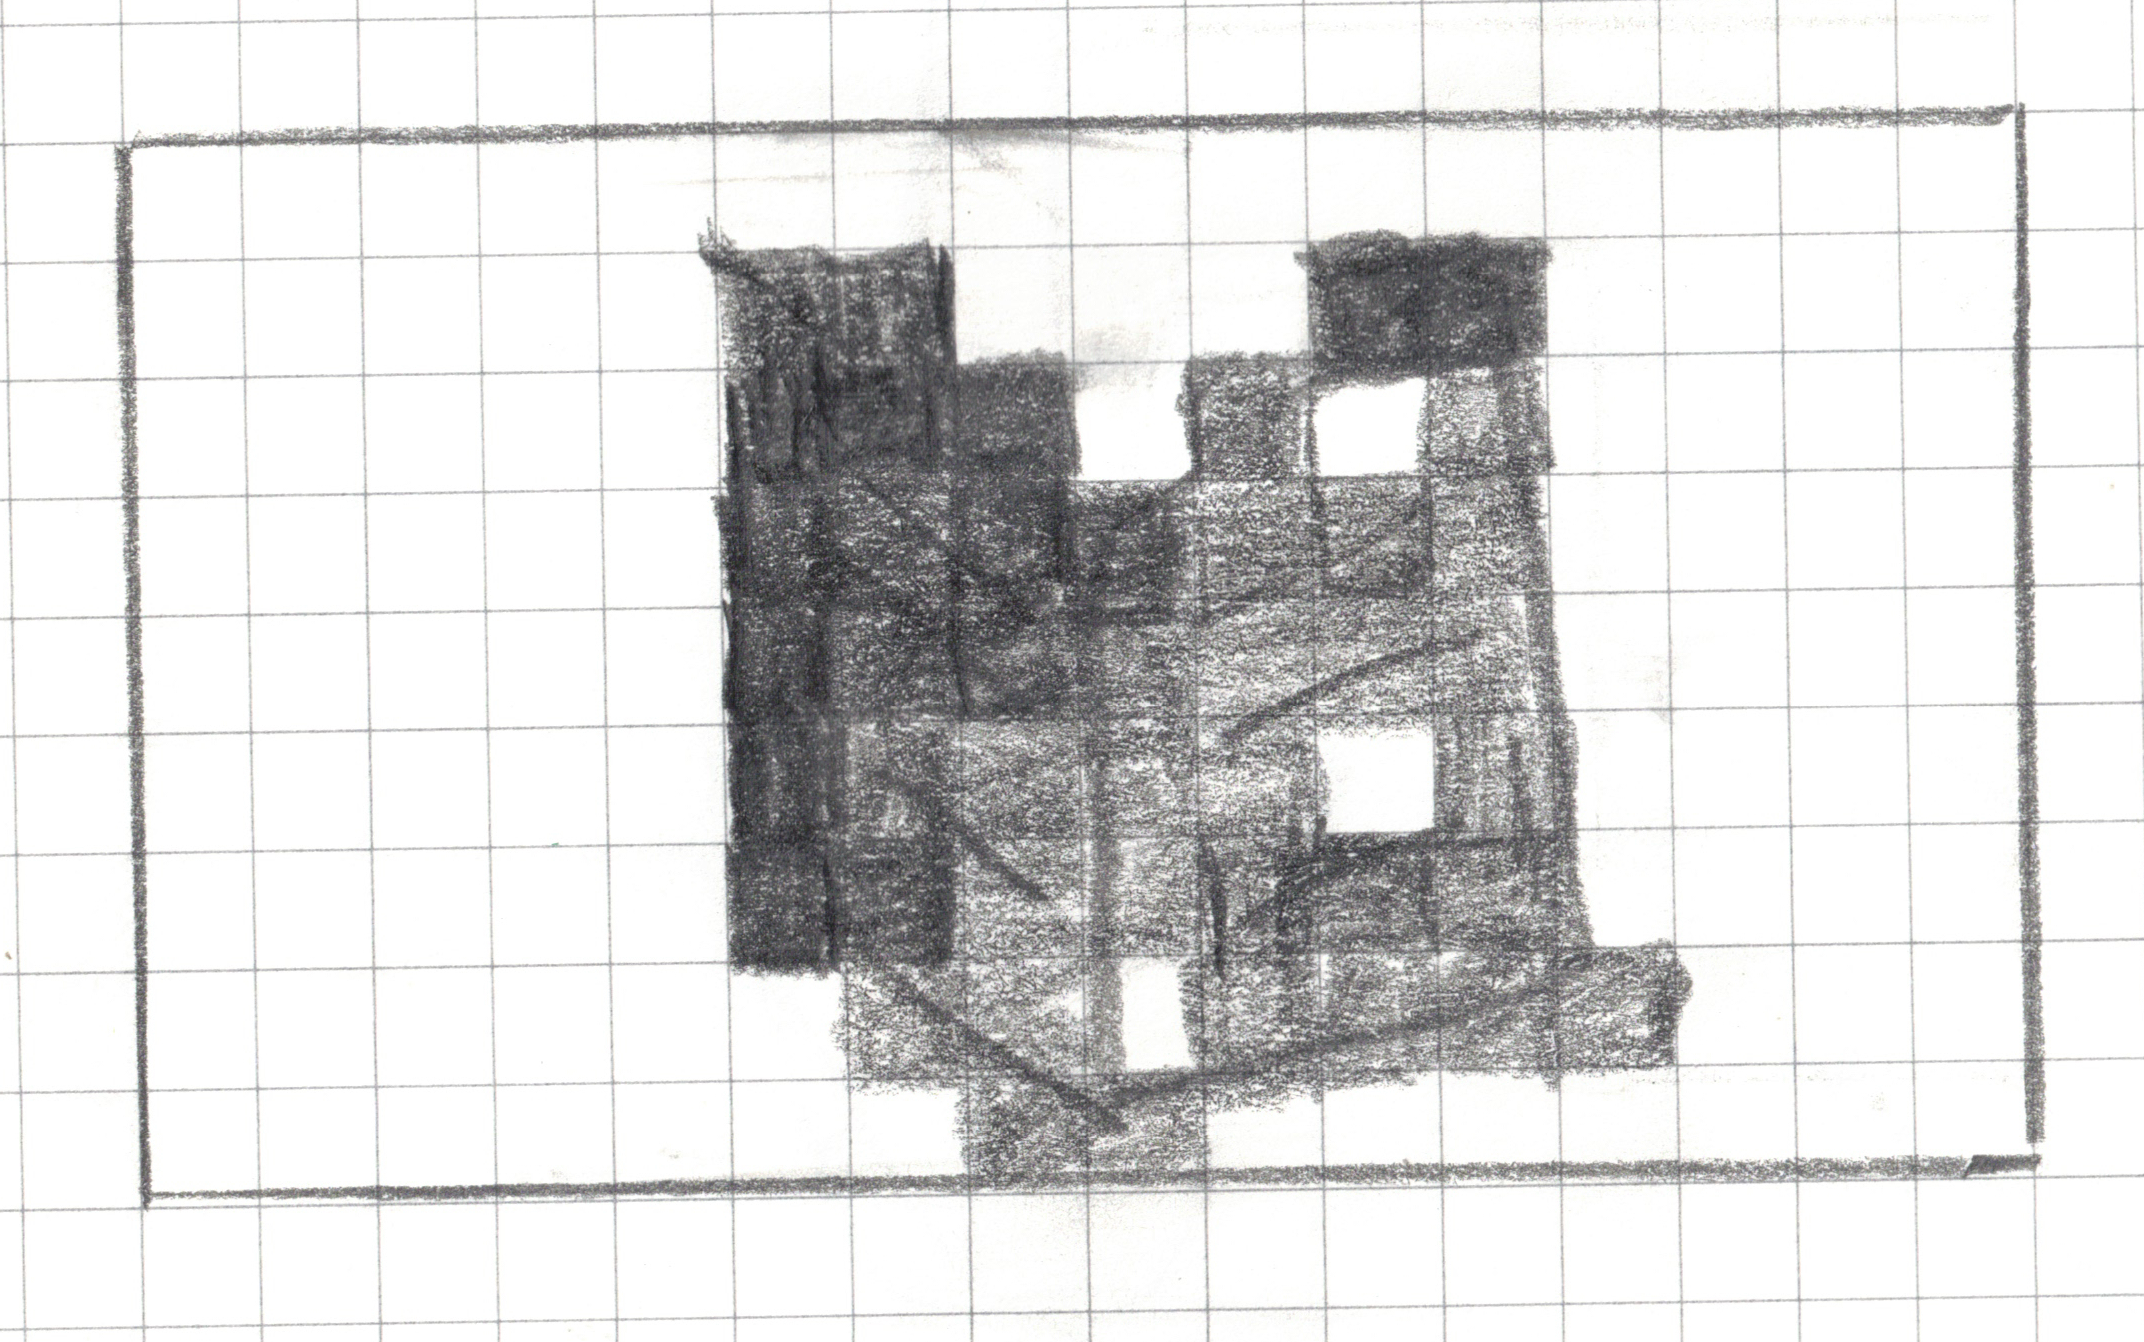
A pixel art design drawn in pencil on a 16x9 graph paper grid. Columns and rows are not labeled but for the purposes of this alt text assume that the columns are labeled a-p, rows 1-9. The irregular shape consists of various shades of gray pencil markings, with some internal white (unshaded) cells. Shaded cells include f2, g2, k2, l2, f3, g3, h3, j3, l3, f4, g4, h4, i4, j4, k4, l4, f5, g5, h5, i5, j5, k5, l5, f6, g6, h6, i6, j6, l6, f7, g7, h7, i7, j7, k7, l7, g8, h8, j8, k8, l8, m8, h9, i9.

Step 4: Write your algorithm

Use your drawing as well as the drawings of your teammates (only your teammates) to come up with an algorithm (a set of rules) that can identify an open book. In other words, the algorithm should should identify whether the drawn book is open or closed.

MY CLASSIFICATION ALGORITHM

Algorithm Name: _______________________

My Rule (write it step-by-step):
1. ____________________________________________________
2. ____________________________________________________
3. ____________________________________________________
4. Classification Decision:
if _________________ then predict “open”.
else predict “closed”.

The Vertical Gap Scanner

  1. Go through the image one row at a time, from top to bottom.

  2. For each row, check if it qualifies as a “Gapped Row.” A row is a “Gapped Row” if it meets both of these conditions:

  • It has at least one filled-in square.
  • It has 3 empty squares between its leftmost filled square and its rightmost filled square.

The Vertical Gap Scanner

  1. Count the number of gapped rows and save it as gap_row_count.

  2. Classification Decision:
    if gap_row_count >= 1 then predict “open”.
    else predict “closed”.

Step 5: Test your model

image_id actual_class predicted_class
1
2
.
.
.
9
10

Image Example 1

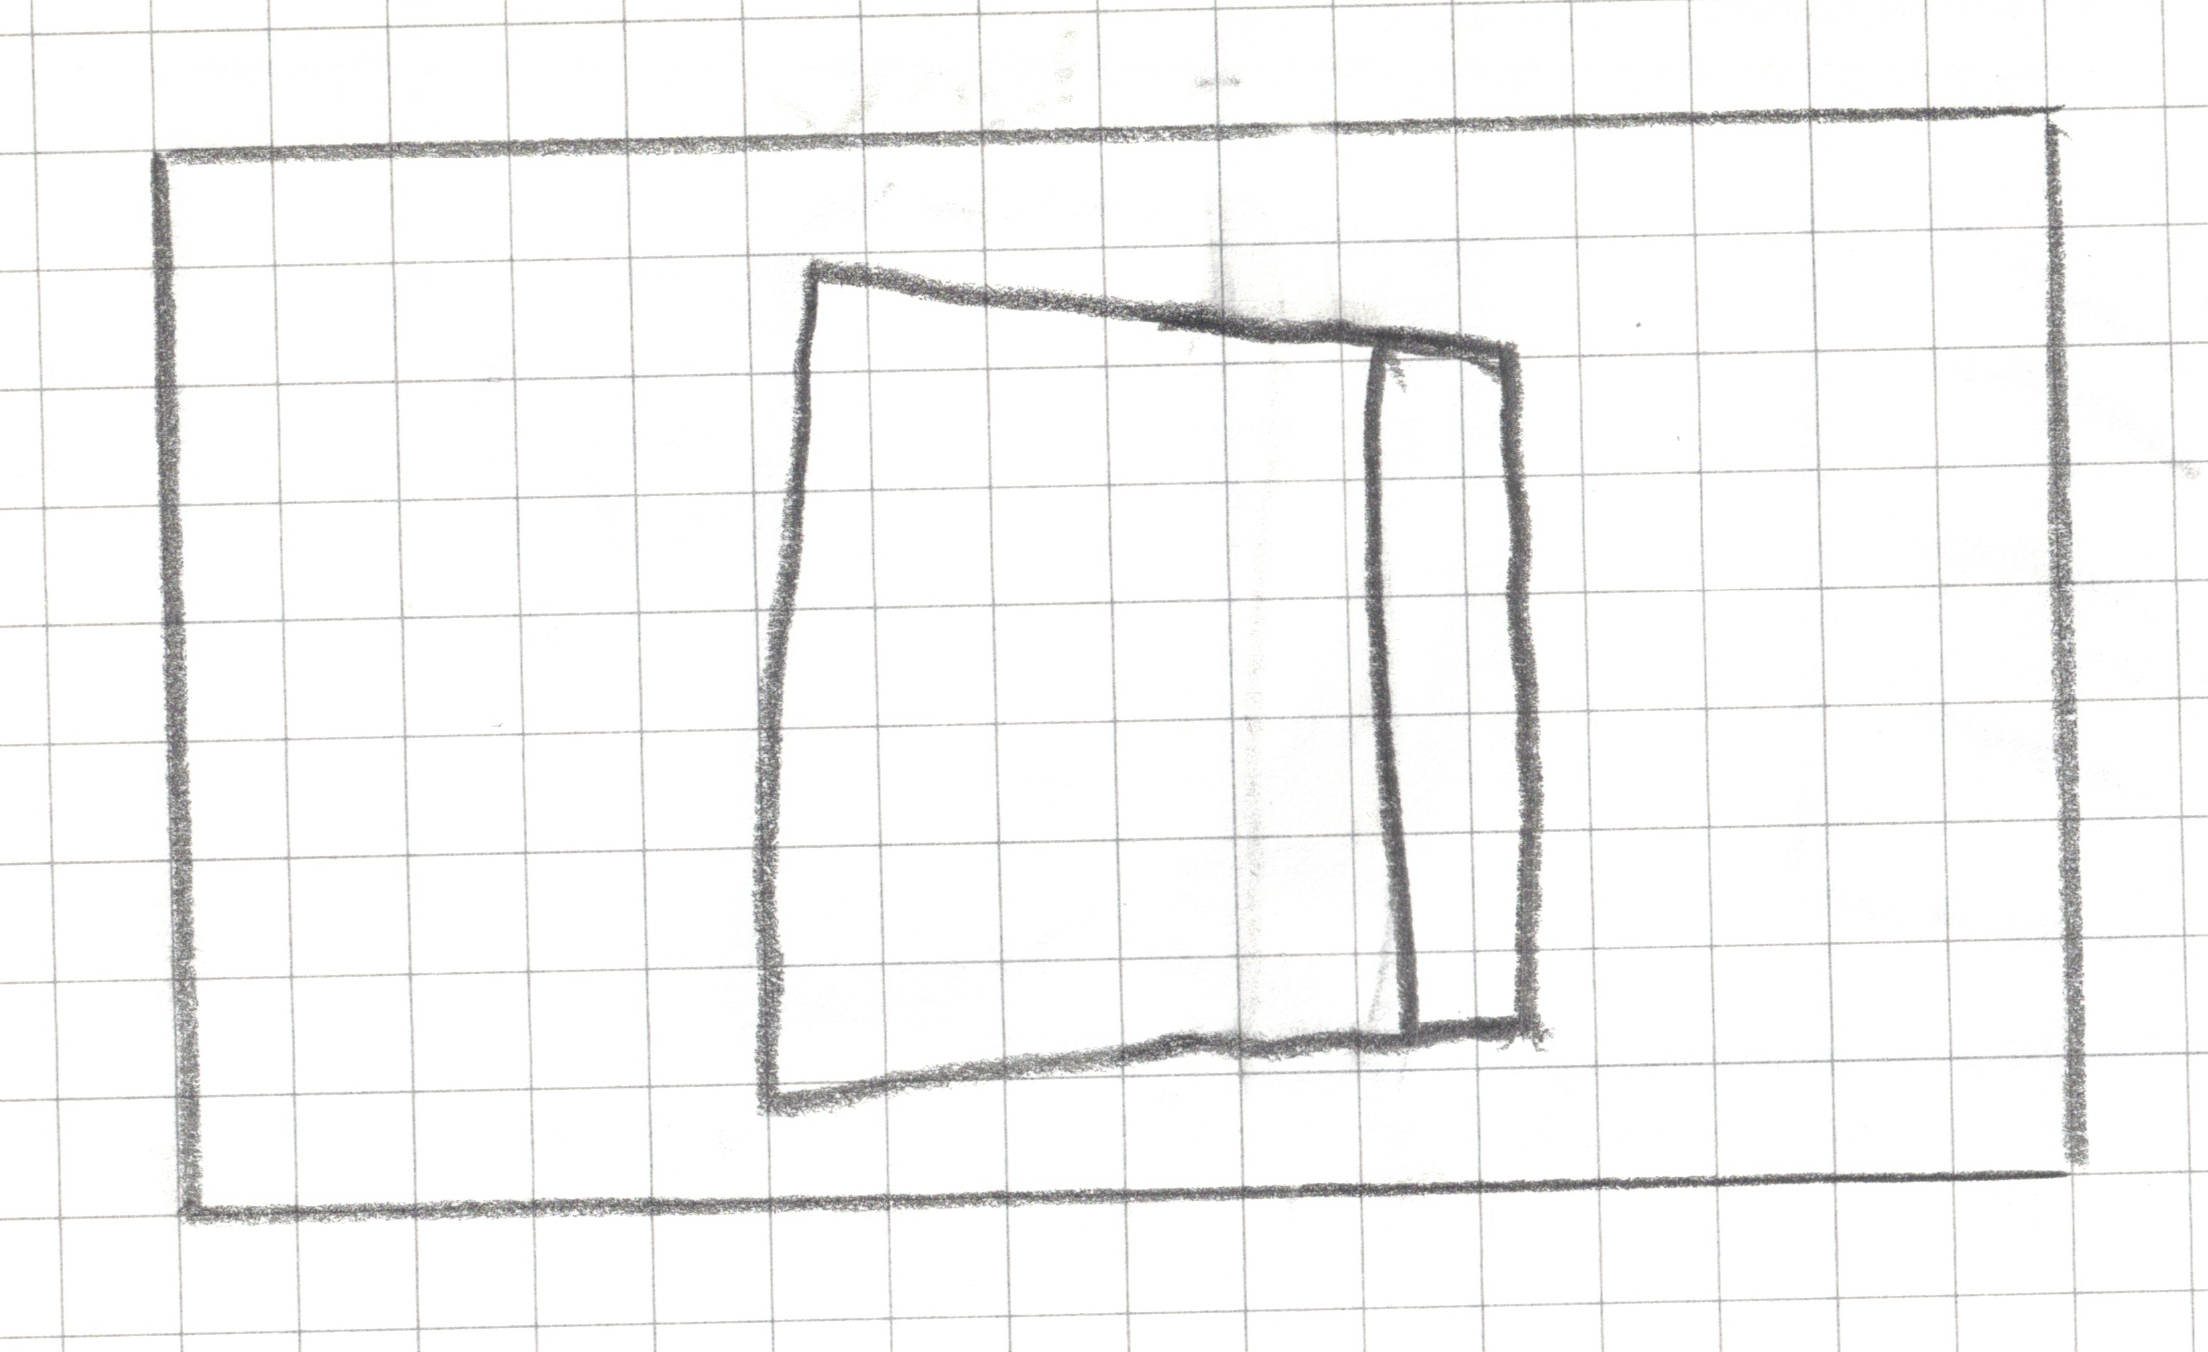
closed book image with only edges and spine drawn from the back cover view

actual_class = closed

Image Example 1
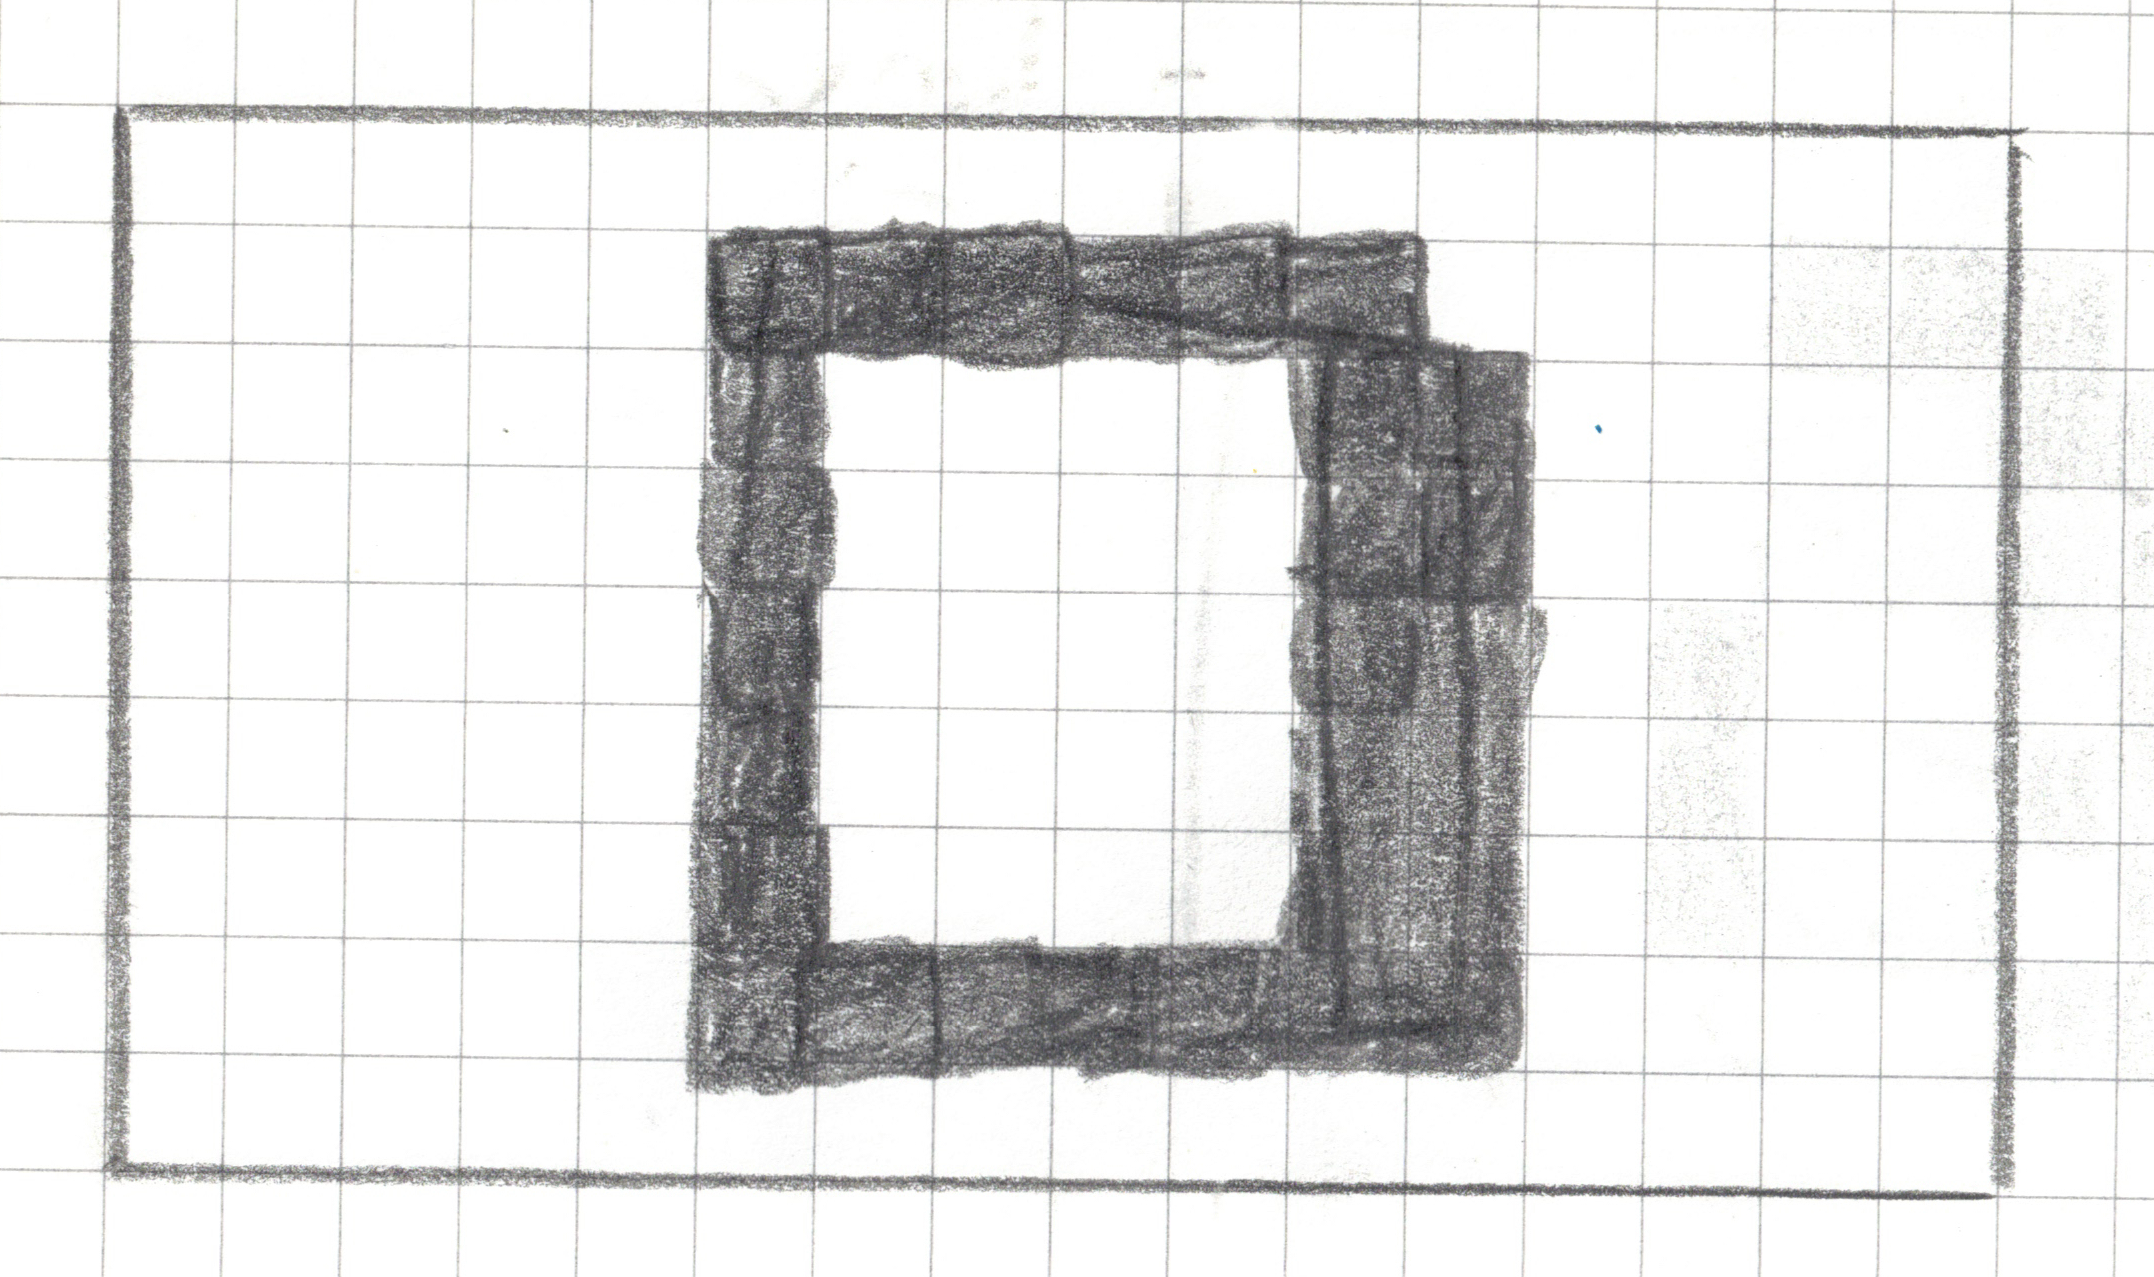
A pixel art design drawn in pencil on a 16x9 graph paper grid. Columns and rows are not labeled but for the purposes of this alt text assume that the columns are labeled a-p, rows 1-9. The irregular shape consists of various shades of gray pencil markings, with some internal white (unshaded) cells. Shaded cells include f2, g2, h2, i2, j2, k2, f3, k3, l3, f4, k4, l4, f5, k5, l5, f6, k6, l6, f7, k7, l7, f8, g8, h8, i8, j8, k8, l8

predicted_class = ?

Image Example 2

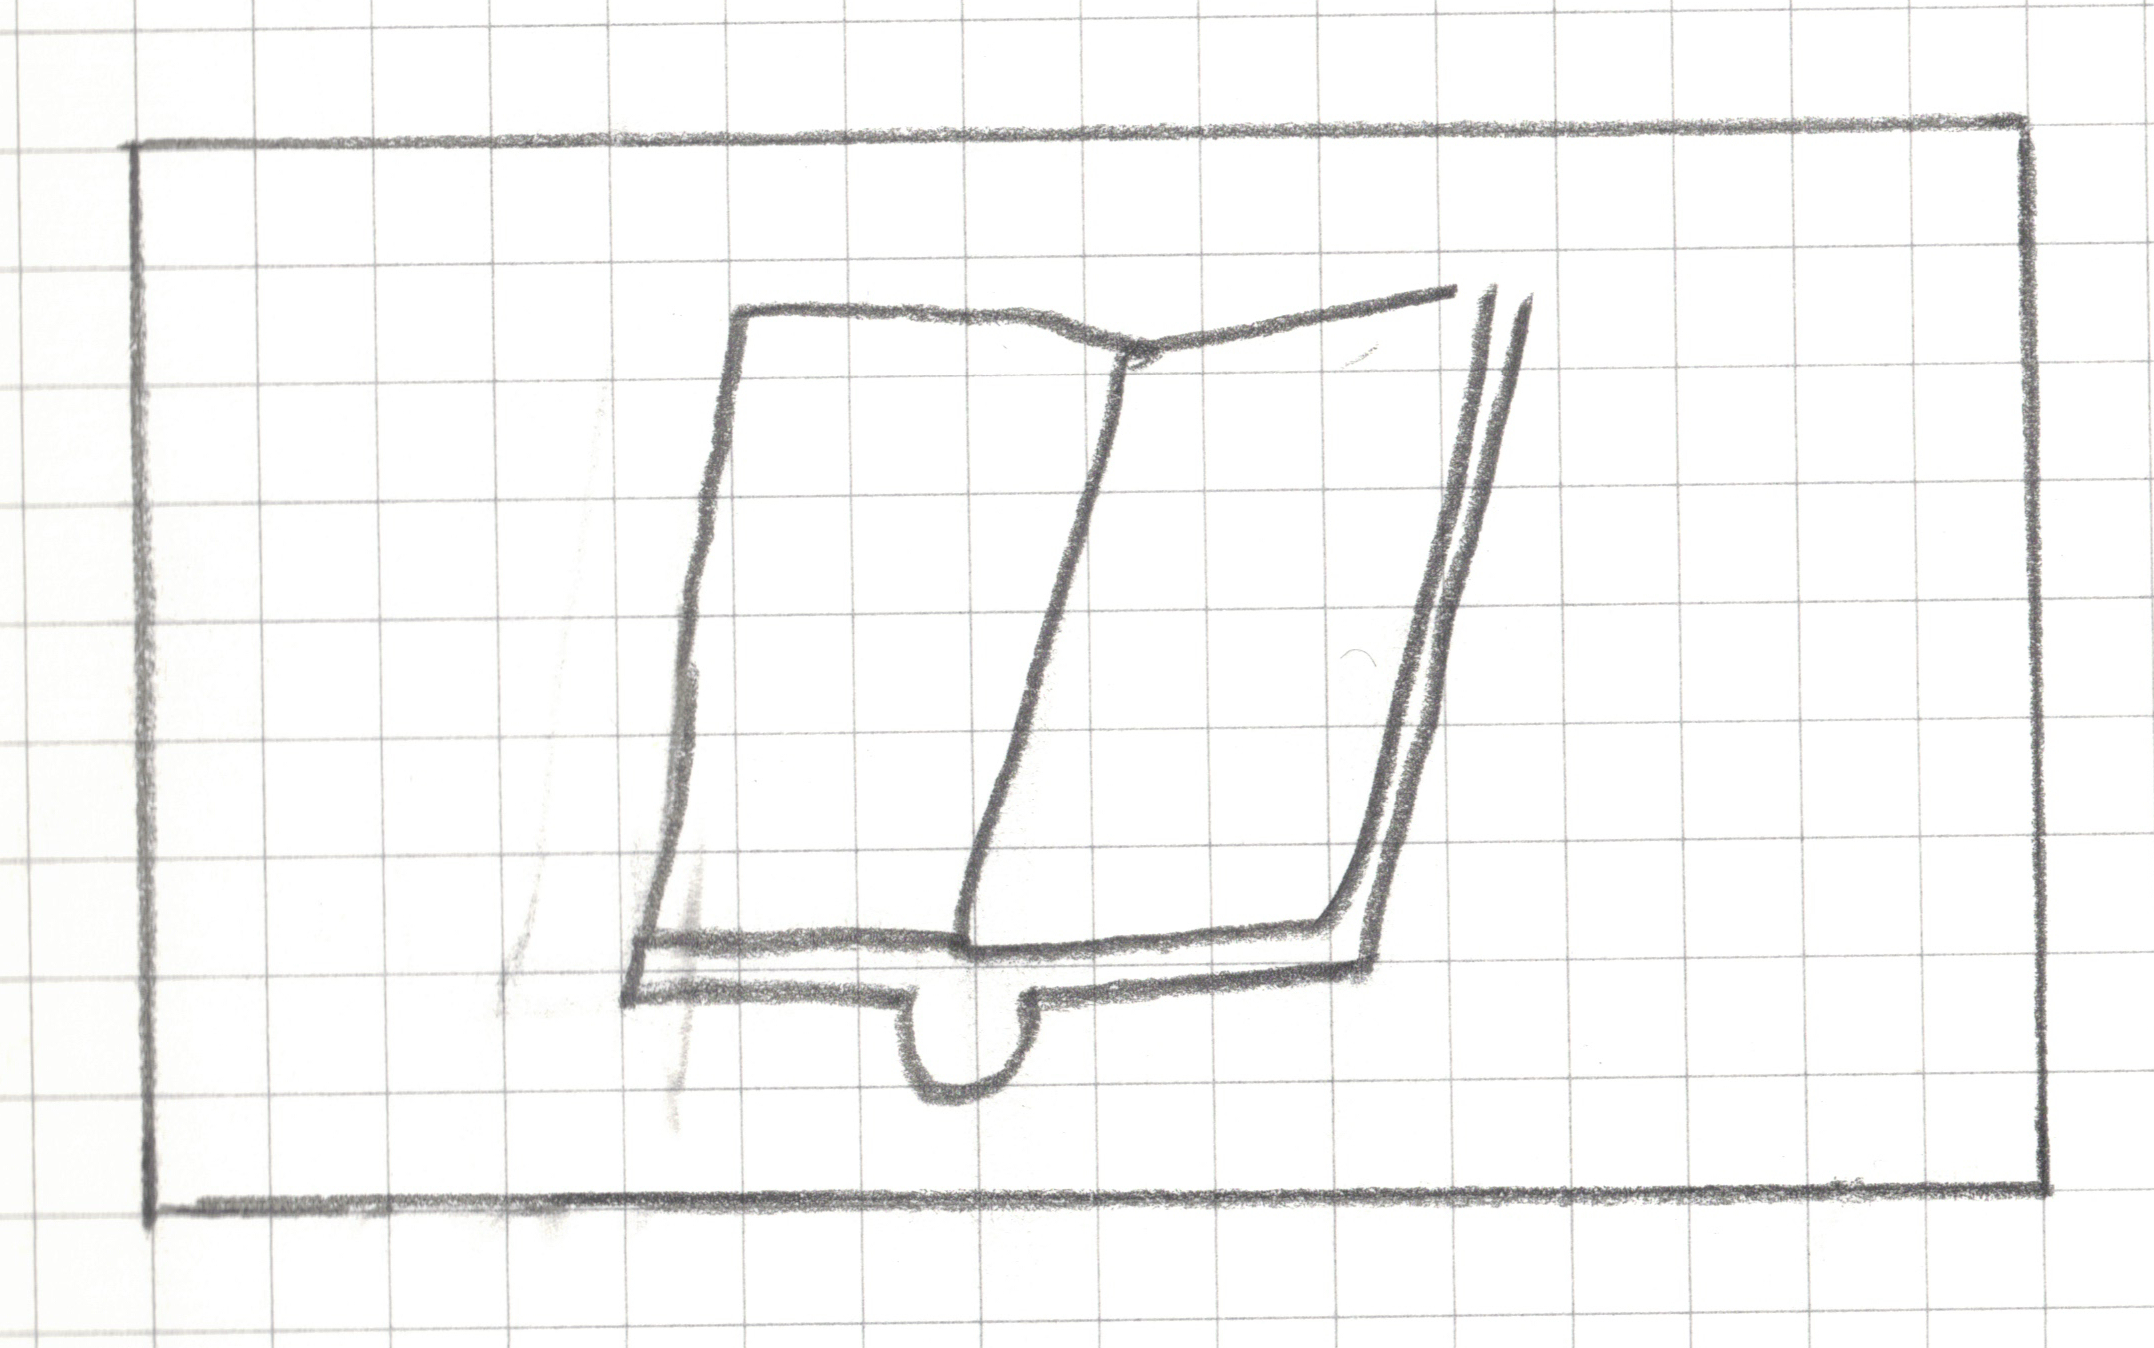
an open book or journal viewed from a three-quarter perspective, tilted slightly to the right. The book is split by a central line for the spine, with both pages completely blank inside. Along the bottom edge of the spine, a small U-shaped loop curves downward.

actual_class = open

Image Example 2

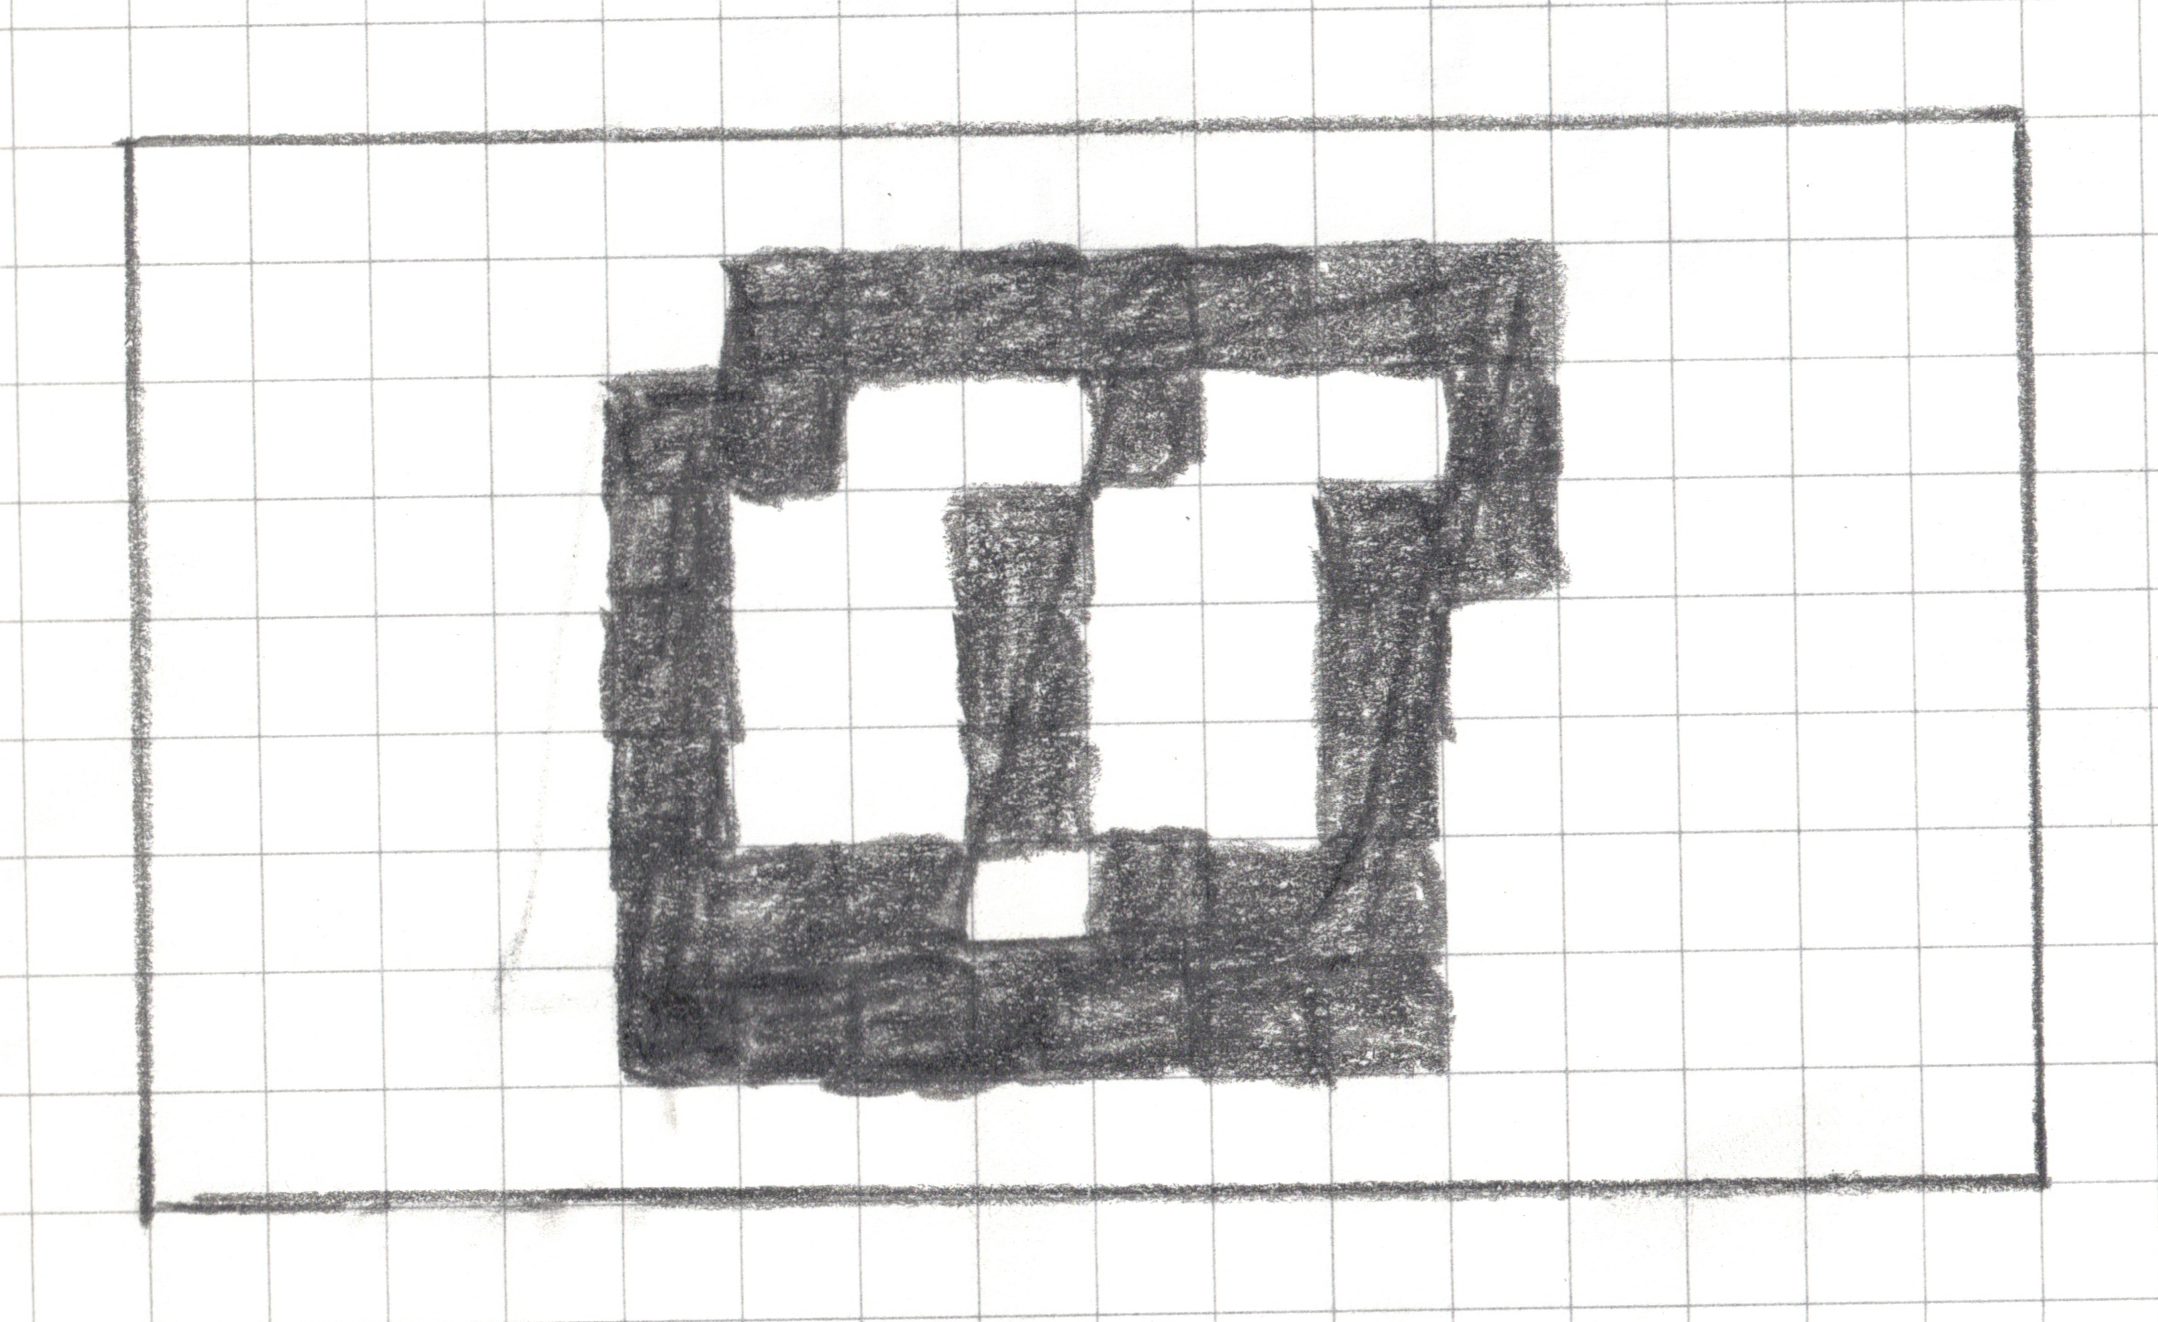
A pixel art design drawn in pencil on a 16x9 graph paper grid. Columns and rows are not labeled but for the purposes of this alt text assume that the columns are labeled a-p, rows 1-9. The irregular shape consists of various shades of gray pencil markings, with some internal white (unshaded) cells. Shaded cells include f2, g2, h2, i2, j2, k2, l2, e3, f3, i3, l3, e4, h4, k4, l4, e5, h5, k5, e6, h6, k6, e7, f7, g7, i7, j7, k7, e8, f8, g8, h8, i8, j8, k8

predicted_class = ?

Image Example 3

The drawing depicts a single closed book standing upright and viewed from a dynamic three-quarter side angle.

actual_class = closed

Image Example 3
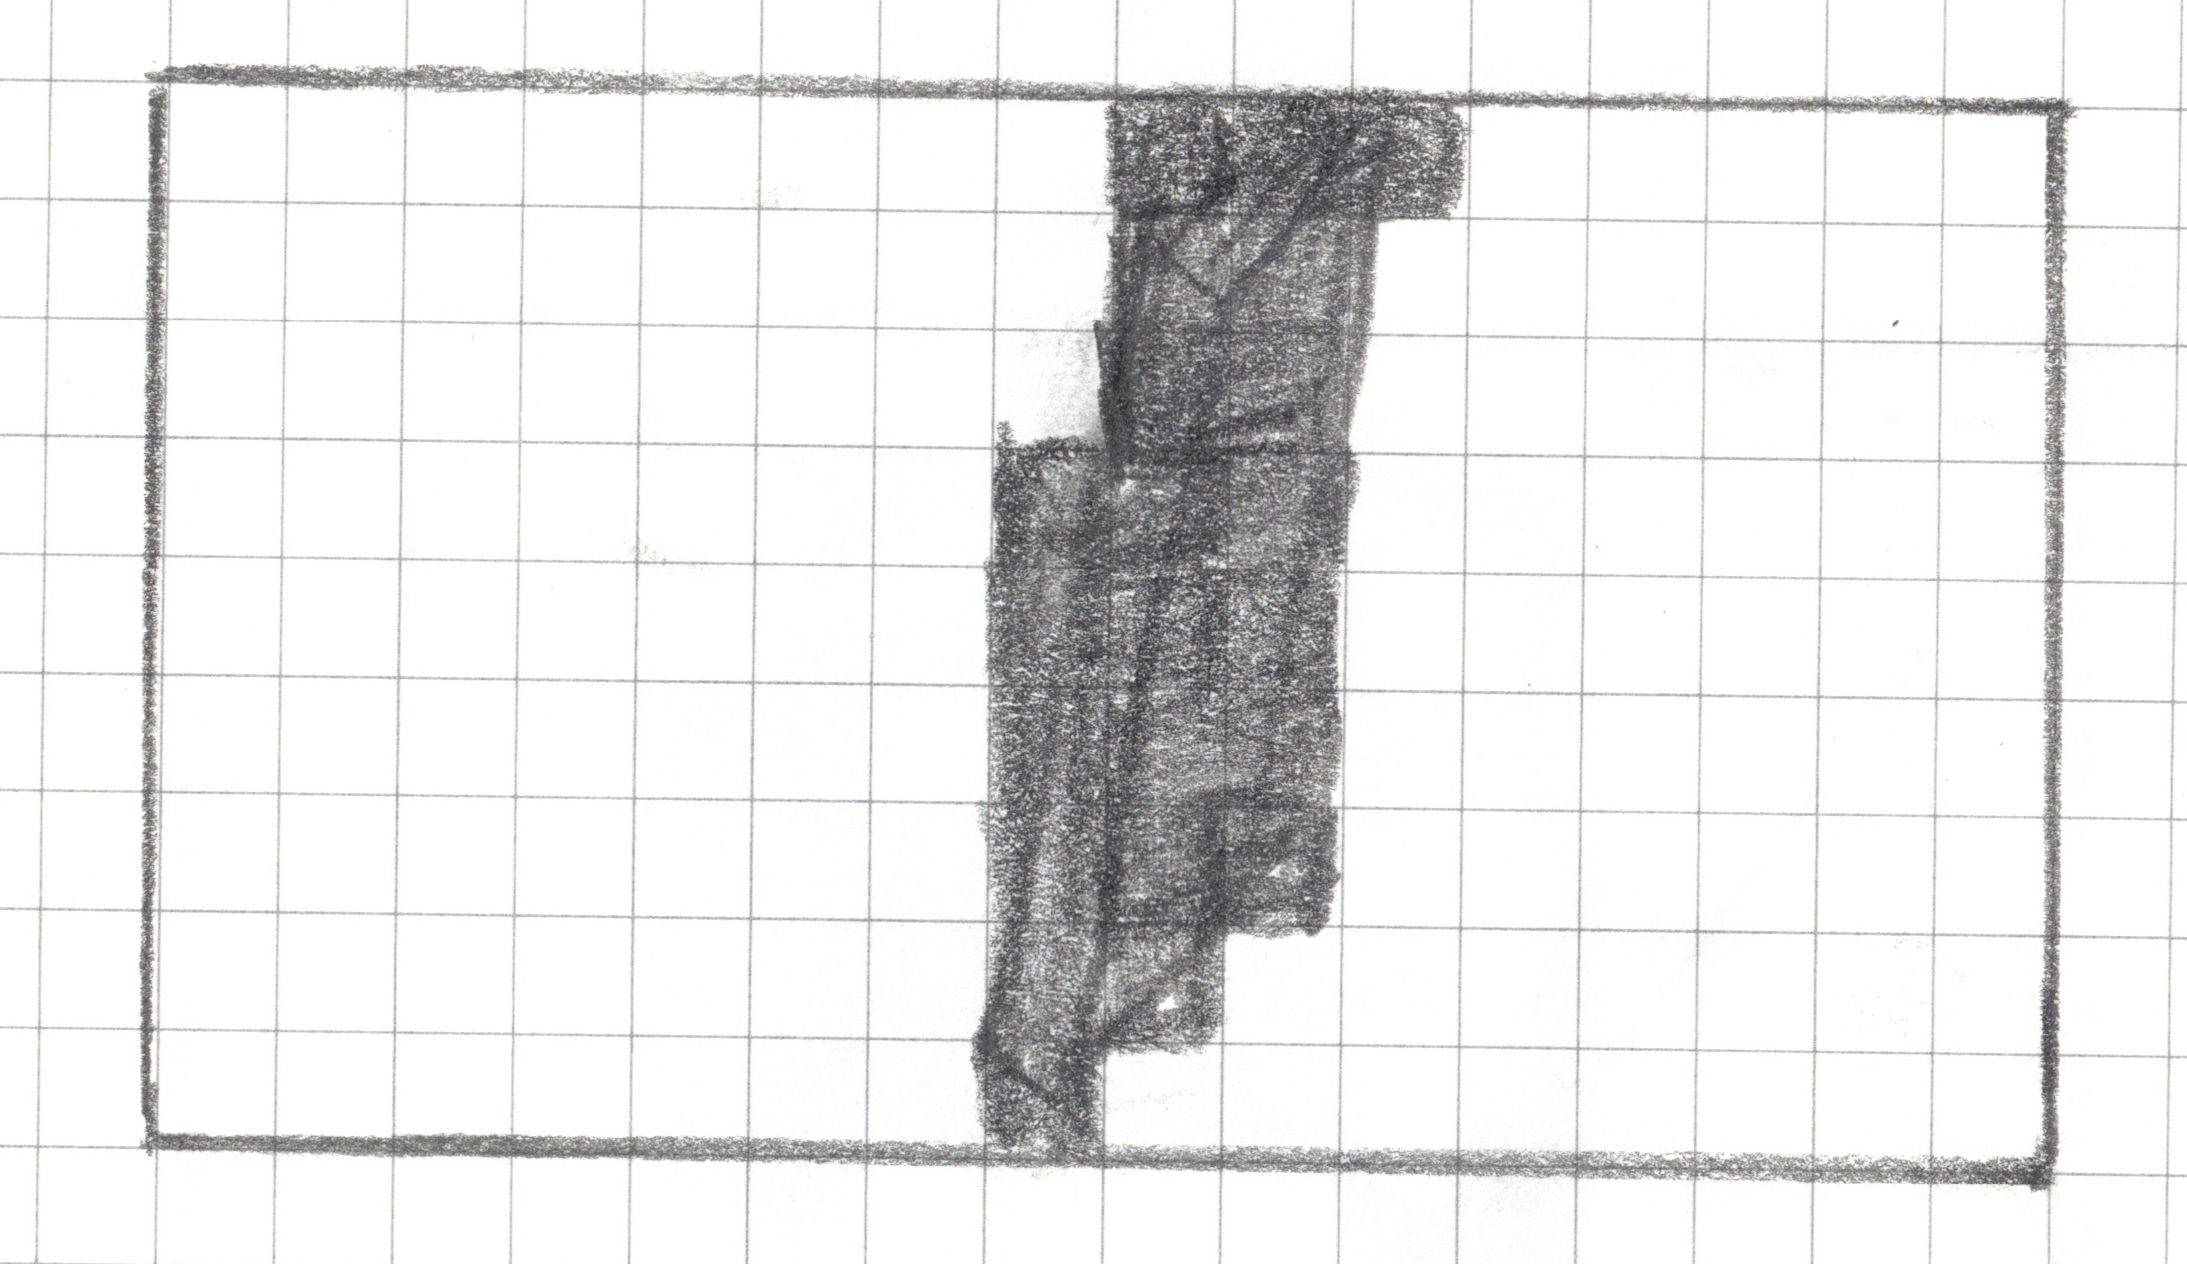
A pixel art design drawn in pencil on a 16x9 graph paper grid. Columns and rows are not labeled but for the purposes of this alt text assume that the columns are labeled a-p, rows 1-9. The irregular shape consists of various shades of gray pencil markings, with some internal white (unshaded) cells. Shaded cells include i1, j1, k1, i2, j2, i3, j3, h4, i4, j4, h5, i5, j5, h5, i6, j6, h7, i7, j7, h8, i8, h9

predicted_class = ?

More Testing Data

Quick, Draw

Model Evaluation

Criteria Predicted: OPEN Predicted: CLOSED
Actual: OPEN _________
(True Positive)
________
(False Negative)
Actual: CLOSED _______
(False Positive)
________
(True Negative)

Definitions and Discussions

  • What is an algorithm? What is a model?

  • Are there perfect models? What happens if we have perfect models?

  • Training vs. testing

Wrap up and Q & A

Keep up to date via Google Form link

catalina.medina@csuci.edu, acastro@cypresscollege.edu, mdogucu@uci.edu

Acknowledgements

We would like to thank the National Science Foundation (NSF) for funding the collaborative project #2123366 and #2123384. All authors have collaborated in this project, and it is this project that has supported improvements to our courses and creation of one of our courses.